
Make sense of iOS crash reports
A macOS app that opens .ips, .crash, and Jetsam log files and turns them into structured, readable views — with case management and an optional AI reporter to explain what went wrong.
Key Features
Drag in .ips, .crash, or .txt files, including Jetsam memory-pressure event logs, or open them with Cmd+O.
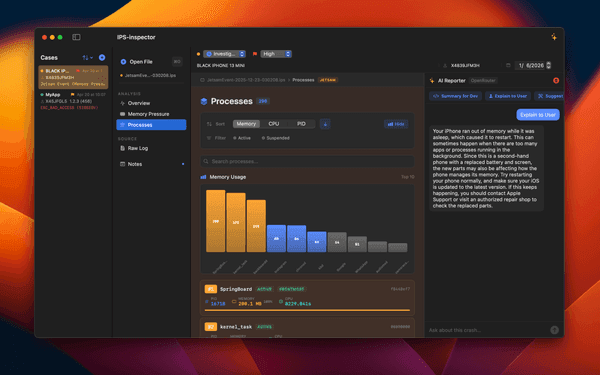
Cases on the left, report sections in the middle, and the selected section's detail on the right.
Memory-pressure logs get dedicated views for device memory stats, per-process breakdown, and footprint data.
Ask questions or request a root-cause summary with the whole crash report in context, then pin answers to the case's AI notes.
Why We Built This
A crash report is a wall of text until someone parses it
A raw .ips file is thousands of lines of JSON and stack frames, and the useful part — which thread, which exception, which framework — is buried. IPS Inspector parses it into an overview, exception, thread, and binary image view, and keeps a copy of every report you open as a case in the sidebar so you can track it from New to Fixed with notes and priority. Jetsam memory-pressure logs get their own views, since they aren't crashes at all. The AI Reporter is optional and can run entirely locally through Ollama if you'd rather not send a client's crash log anywhere.
Overview, exception, threads, and binary images are split into their own sections — the raw log is still one click away.
Every file you open is saved as a case with status, priority, client name, and notes that persist across launches.
The AI Reporter runs against Ollama on your own machine, or OpenRouter or Claude if you supply a key.
Get Started Today
Get IPS Inspector on your preferred platform — it takes seconds.